Comparisons
This interactive slider allows elevation models from two survey dates to be compared side by side. The colour scale represents surface height within each model, helping to visualise the beach shape, raised areas, lower areas and general changes in form over time.
These outputs are intended for visual interpretation rather than direct height-change measurement. As the elevation models may not share the exact same reference level, colour differences should be treated as indicative of relative surface patterns rather than precise measured change.
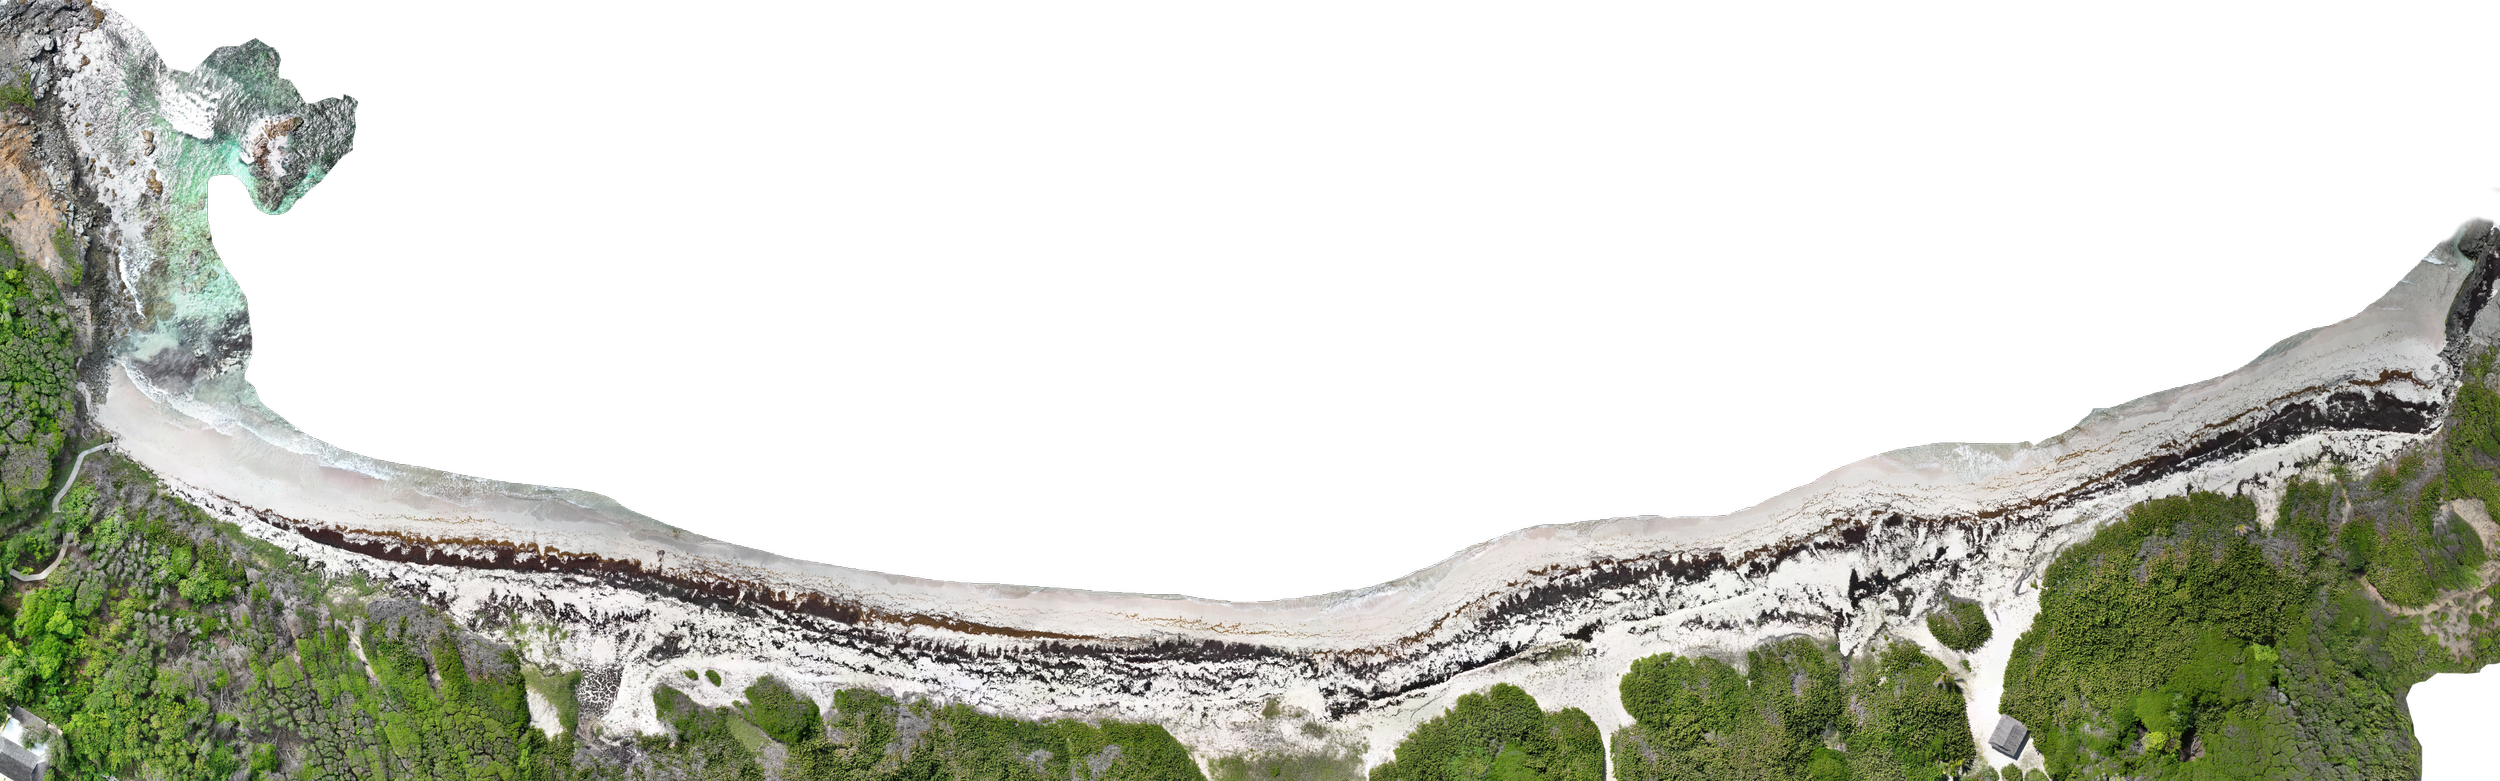
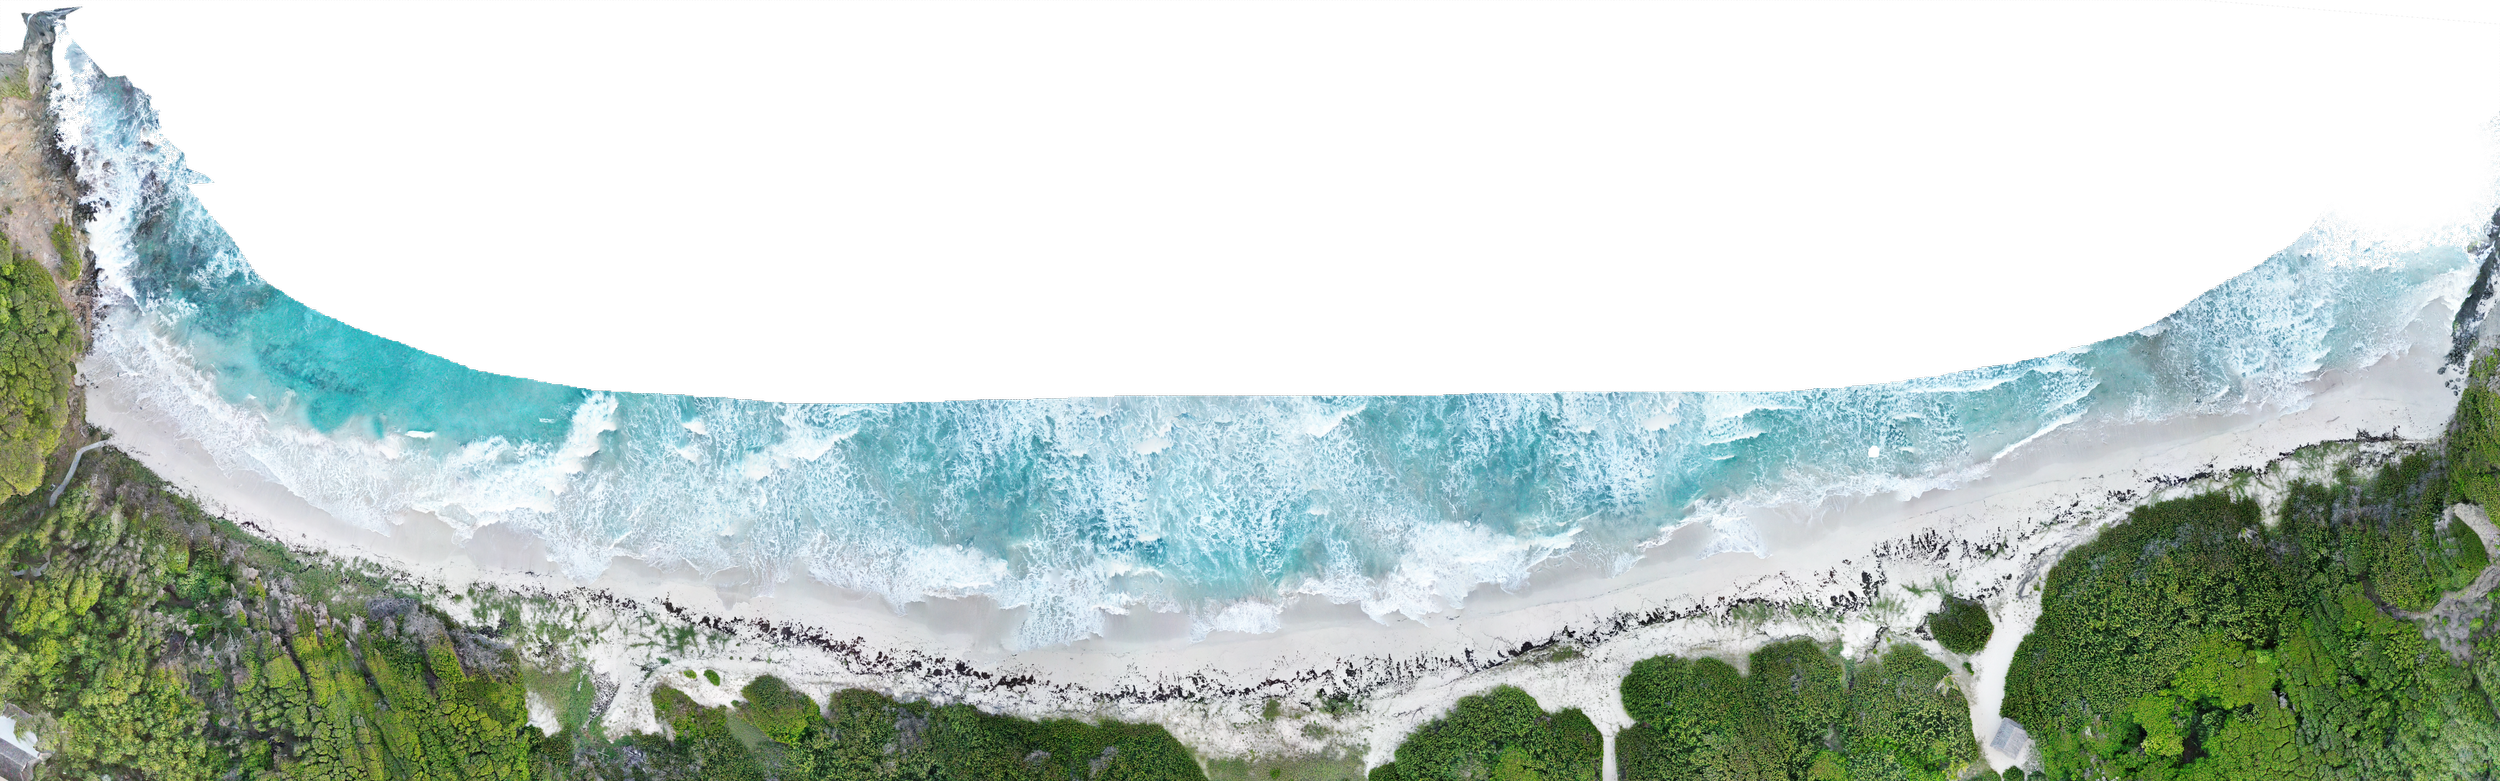
Textured View
Textured views offer a realistic representation of the surveyed beaches for public-facing use. Used alongside elevation data, they help link measured surface changes to visible features and support comparison with older satellite imagery.